Stocks
Questions:
1) International Business Machines
2) Microsoft Corp.
3) McDonald's Corp.
4) Microsoft Corp.
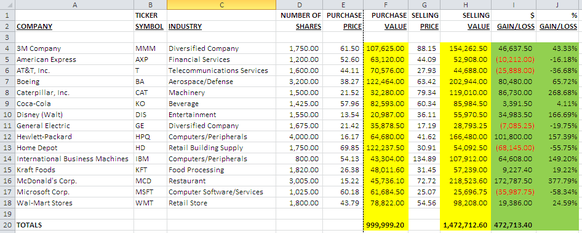
5) I think McDonald's would be a good purchase in order to make a profit in the future because it has the highest selling value and the largest percentage gain.
In this Stocks assignment I had to look at the exercise sheet and copy the information that was given in Excel. After that I needed to put in formulas for certain columns to find values and prices. I also had to change the format of the percentages to percents and to make sure that they appeared red and in parentheses because some of them were negative numbers. Then, i needed to highlight columns F and H in yellow and highlight columns I and J in light green, and finally find the totals. The technology skills I needed to use for this assignment were basically the same for the other Excel assignments except for the one where I inserted a header and a footer. It seemed a little different than inserting one in Microsoft Word. What I learned from doing this assignment was how to make the appearance of negative numbers be red and in parentheses. That's really the only new thing that I learned in this exercise. In this assignment I think I did everything pretty well, the only thing I had trouble with was keeping track of putting the information in the right cells and not getting it mixed up. If I were to do my work different and improve it, I would probably just check over my work one more time and make sure there isn't any mistakes because I think I did all the steps pretty well and I'm not sure what there is to improve. Also make it look more presentable and add in borders and more format.
1) International Business Machines
2) Microsoft Corp.
3) McDonald's Corp.
4) Microsoft Corp.
5) I think McDonald's would be a good purchase in order to make a profit in the future because it has the highest selling value and the largest percentage gain.
In this Stocks assignment I had to look at the exercise sheet and copy the information that was given in Excel. After that I needed to put in formulas for certain columns to find values and prices. I also had to change the format of the percentages to percents and to make sure that they appeared red and in parentheses because some of them were negative numbers. Then, i needed to highlight columns F and H in yellow and highlight columns I and J in light green, and finally find the totals. The technology skills I needed to use for this assignment were basically the same for the other Excel assignments except for the one where I inserted a header and a footer. It seemed a little different than inserting one in Microsoft Word. What I learned from doing this assignment was how to make the appearance of negative numbers be red and in parentheses. That's really the only new thing that I learned in this exercise. In this assignment I think I did everything pretty well, the only thing I had trouble with was keeping track of putting the information in the right cells and not getting it mixed up. If I were to do my work different and improve it, I would probably just check over my work one more time and make sure there isn't any mistakes because I think I did all the steps pretty well and I'm not sure what there is to improve. Also make it look more presentable and add in borders and more format.
Excel22
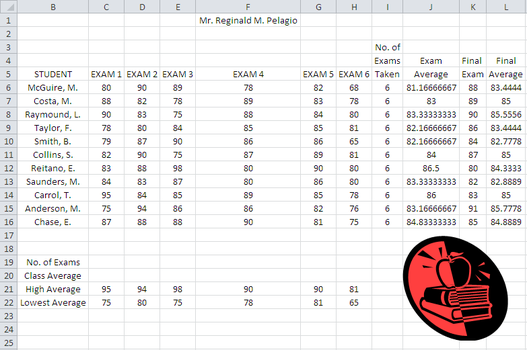
For the exercise Excel 22, I had to copy the information on the handout, and then I had to put in certain formulas to find the number of exams taken, the average of the exams, the highest average, the lowest average, and the final average. I also had to insert a picture that pertained to the exercise. The technology skills I had to use to complete the assignment were just to use excel, and to insert formulas to find the correct outcome. I also needed to know how to insert Clip Art. I learned new formluas by doing this activity, and I also learned more about how to find the high, low, and final average. In this assigment I feel I did well on it. It looks organized and I think I put the picture that corresponds with the information in a good spot so it doesn't throw off the neatness of the page. If I were to do anything differently in this activity to improve it I would make it more attractive and format it more to make it eye-catching.
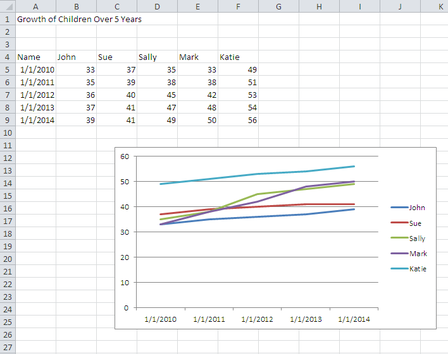
Group Project (Line Graphs)
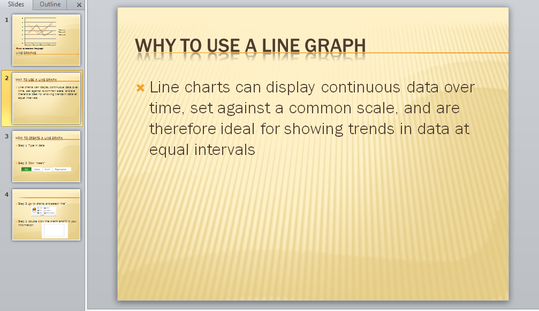
For this assignment, I was assigned with a group. I had to work with my group to make a presentation about line graphs/charts. We had to come up with a PowerPoint with steps on how to make one, and why to use one. We also had to make an activity for the class to do that had to do with creating a line graph/chart with data. Technology skills were required for Microsoft PowerPoint and Microsoft Excel. I first of all had to know how to create a PowerPoint, but I also needed to know how to format it and make it detailed. I needed to know how to use the snipping tool so that I could take screenshots of the steps in Excel that you use to make a line graph. Using Excel was another big technology skill that was needed. I obviously had to know how to create a line graph myself before my team and I could make a demo of it. What I learned from this assignment was how to create all types of graphs. Not only technology wise, but I learned how to cooperate with new people and work in a group and make a presentation in front of the class. In this assignment I think I contributed well to the group and the project. I also think that we did well with the activity part of the assignment, creating and demonstrating it. If I were to do this group project differently I would improve on the PowerPoint I would add more background information about line graphs because it would help the presentation in the long run so it wouldn't be boring and short. I would also format it better and make it more attractive so the class would want to pay attention to it.
Group Activity
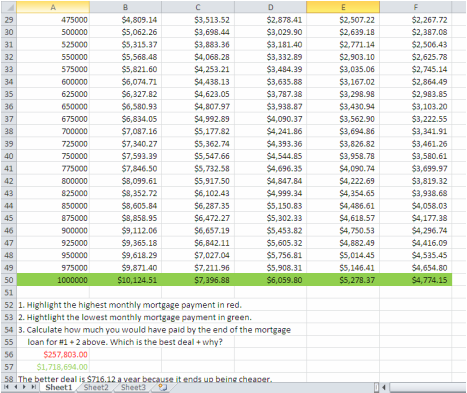
Activity 50- Yacht Mortgage
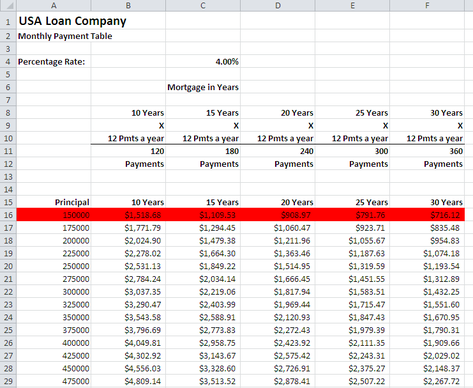
In this activity, I had to copy the data from a sheet that was given, and then insert formulas in each column and then AutoFill it. Then I had to make sure that I made the columns the correct width, and made the words that were supposed to be bold, bold. I also needed to highlight the highest and lowest in green and red. The technology skills needed to be used in this were basically the same, you just need to know how to use Excel properly. Formulas are the most important though, I needed to know how to insert formulas and use them correctly. What I learned was a new formula. I also learned more on how to sort the information because I had trouble with that in the past. I think I did everything fairly well in this assignment, I feel as though I could have done better with answering the questions.